You Set the Goal.
Loopra Delivers the Uplift.

End-to-end from uncovering the best grids to running it every day — labor, parts, advisors, and live ROs.

$1M+ annual uplift +$1.44M one rooftop Live RO loss prevention

From Static Pricing to Daily Execution

Pain

Guesswork grids & silent leaks

Labor curves and parts markups sit unchanged for years. Advisors drift below grid. ROs close with money already gone.

Loopra move

Agents that run the goal

Build the best grids, coach who drifts, and monitor every RO in real time — so the goal becomes how the store operates.

Result

$1M+ annual uplift potential

Customer-pay labor, parts, and warranty reimbursement — projected on your RO history before you go live.

From Goal to Captured Revenue

You set rate and revenue goals. Loopra’s agents deliver them — end to end, every day.

STEP 1

Set Your Goal

Pick the uplift targets you want to hit — labor rate, parts markup, and revenue goals for the store or group.

Labor rate +$15/hr Parts markup +25%
STEP 2

Agents at Work

Build the best grids, spot advisors who drift from the goal, and monitor every RO in real time to stop leaks before close.

STEP 3

Uplift Revenue

Projected and proven outcomes on your own RO history — customer-pay labor, parts, and warranty reimbursement.

$1M+ annual revenue uplift

Stop Guessing Your Pricing Grid

Generate the best, most customer-friendly labor rates and parts markups from your RO history — then tune any billed-hour rate, cost bucket, and markup to match your strategy, with projected impact before you go live.

  • Generate best grids — uncover the labor curve and parts markup grid aligned to your goal
  • Tune your way — adjust billed-hour rates, cost buckets, and markups without a black box
  • See the impact — estimated ELR, parts markup, and projected customer-pay and warranty revenue
  • Protect retention — optimize for uplift without a blunt hit to customer experience
+$1.44M projected uplift, one rooftop +$511K CP labor · +$723K warranty · +$209K CP parts
Run It on Your Numbers
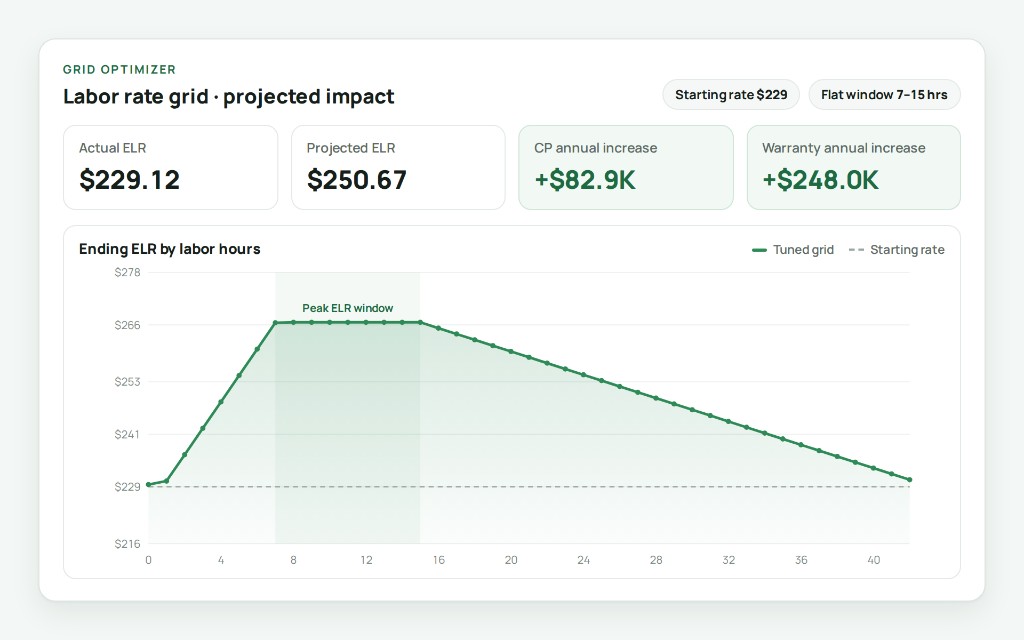
Labor rate matrix calculator with projected ELR and ending ELR graph

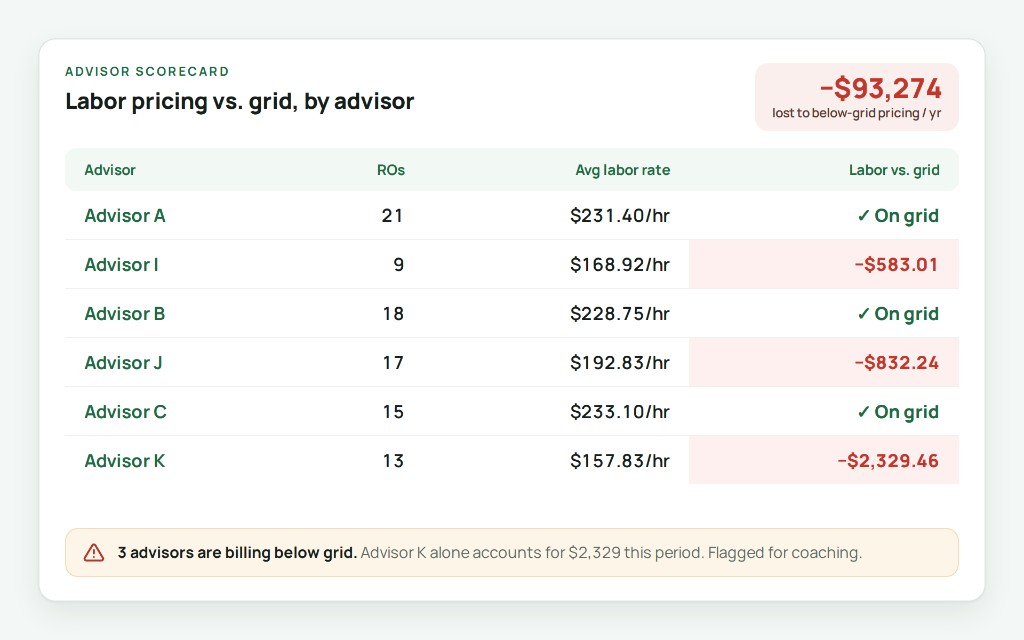
See Where Advisors Misalign With Targets

Measure every advisor. Find leaks. Coach with numbers — labor sold, hours, rates, discounts, and variances against grid in one view.

  • Measure every advisor — labor, rates, discounts, and grid variance in one scorecard
  • Find the leaks — who bills below grid and who discounts most, in dollars
  • Get alerted & coach — spot who needs improvement with real data and clear actions
  • Separate people from process when the same pattern shows up store-wide
−$93,274 lost to below-grid pricing / year (one store)
See Advisor Insights
Advisor scorecard with labor metrics and comparison chart

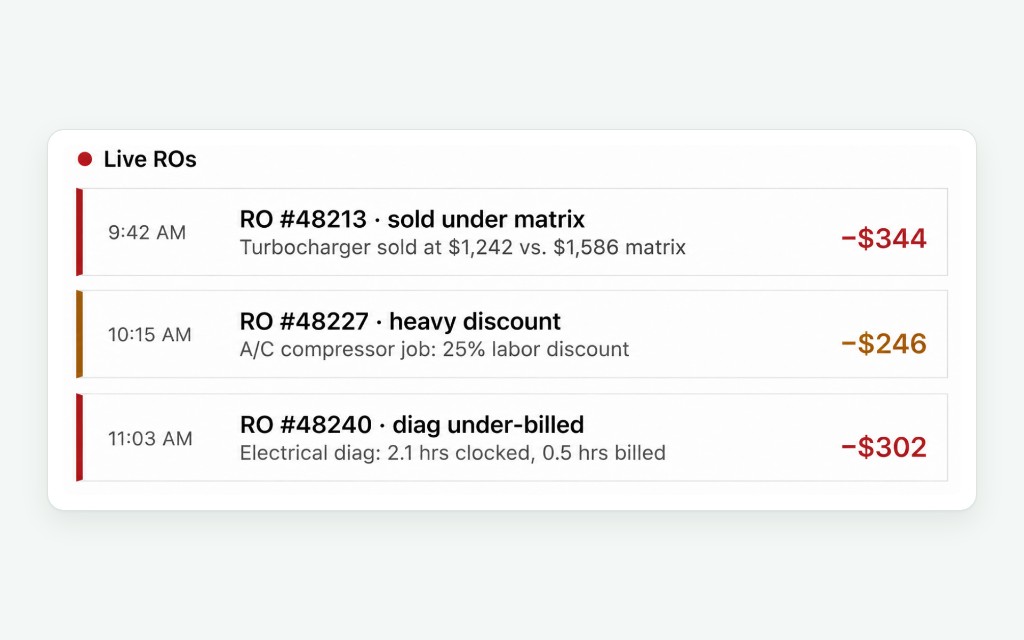
Catch Leaks Before ROs Close

Real-time alerts on under-selling and heavy discounts. Monitor every RO as it flows through the shop — so margin and ELR don’t leak at close.

  • ELR protection — see which ROs are deviating from your grid targets
  • RO-level analytics — labor and parts performance on every repair order
  • Store & group visibility — drill from the group dashboard down to any single RO
  • Live loss prevention — stop leaks while the RO is still open
See Live Monitoring
Live RO monitoring feed showing under-matrix and discount alerts

Outcomes Dealers Measure in Dollars

Figures from real Loopra conversations and customer rooftops. Results vary by dealership, OEM, and state.

$1M+
Annual revenue uplift potential from grid + ops execution
$700K+
Average annual warranty rate increase
$5M+
Warranty opportunity identified across a dealer group
90×
Faster warranty filing — hours, not months

Run It on Your Own Numbers

A free, 20-minute review of your store’s performance on your own repair orders.